
Cap Application Torque vs Removal Torque: Why the Ratio Is Not the Number You Should Watch
Cap application torque vs removal torque explained with spec tables, industry-specific scenarios, and the sampling strategy that matters more than the ratio.
The standard answer fits on a napkin: removal torque should land at 40-60% of application torque. Every guide says it. Every spec table assumes it. But a bottling plant running 48-cavity blow molds passed that ratio on every random QC check while specific cavities were systematically under-torquing caps. The ratio looked fine because the sampling plan never isolated individual cavities. Cap application torque vs removal torque is the relationship between the rotational force a capping machine applies to seat a closure and the rotational force required to unscrew that closure afterward. Understanding the difference is table stakes. Knowing what to monitor, and how to sample, is where torque programs succeed or fail.
What Application Torque and Removal Torque Actually Mean (and the Standard Ratio)
Application torque is the rotational force a capping machine exerts to thread and seat a closure onto a container. Removal torque is the force needed to break that closure free. The two are linked: removal torque depends on application torque, liner compression, thread geometry, and friction at the closure-container interface.
As a rule of thumb, immediate removal torque falls between 40% and 60% of the applied torque. Glass containers generally require lower application torque than plastic containers of the same diameter because rigid glass threads do not deflect under load.
| Cap Diameter | Application Torque, Plastic (in-lb) | Application Torque, Glass (in-lb) | Typical Removal Range (in-lb) |
|---|---|---|---|
| 28 mm | 13-17 | 11-17 | 5-10 |
| 38 mm | 19-23 | 15-23 | 8-14 |
| 63 mm | 31-38 | 25-38 | 12-23 |
Values from published packaging torque references. Actual targets depend on closure type, liner material, and neck finish.
These numbers appear in nearly every torque guide online.
So if the ratio is this well-documented, why do torque-related defects keep showing up on filling lines?
Where the Ratio Breaks Down: Pharma Packaging and Torque Retention
The 40-60% ratio describes a snapshot taken seconds after capping. In pharmaceutical packaging, what determines product integrity is the ratio at 30, 60, or 90 days into shelf life.
A cap applied at 15 in-lb might read 9 in-lb removal torque on day one. At the 90-day stability check, removal torque may have dropped to 4 in-lb. The ratio that passed release testing now fails the retention threshold. Nothing looks wrong visually. The liner material has undergone stress relaxation; its elastic memory slowly reduces contact pressure between closure and container.
| Time Point | Typical Removal Torque Trend | What Changed |
|---|---|---|
| Immediately after capping | 40-60% of application torque | Baseline |
| 24 hours | Noticeable drop | Initial liner relaxation |
| 7-30 days | Continued decline | Ongoing compression set |
| 60-90 days | Stabilizes at lower plateau | Equilibrium reached |
ASTM D2063/D2063M-24 provides the testing framework. Method A measures removal torque on stored containers at user-defined intervals — a static retention test. Method B measures removal torque after simulated distribution (vibration, drops, temperature cycling). Pharma stability protocols typically require Method A at minimum.
Induction sealing compounds the problem. The heat cycle that bonds a foil inner seal causes an immediate torque drop of roughly 60-72% from the pre-seal removal torque value. A cap reading 10 in-lb before induction sealing may read 3-4 in-lb afterward. That drop is expected. Pre-seal and post-seal torque targets must be managed as two separate specifications.
Pharma teams that test only at capping and never at stability intervals are measuring the wrong moment.
Beverage Filling Lines: Why Cavity-to-Cavity Consistency Beats the Ratio
High-speed beverage lines run multi-cavity blow molds (24, 36, or 48 cavities) producing bottles that feed into the same capper. Every bottle gets the same capping head force. Not every bottle has the same neck finish dimensions.
Mold cavities wear at different rates. One cavity might produce bottles with neck land height slightly below nominal; another might run oversized on thread root diameter. These deviations fall within mold tolerance individually. But when the capper applies fixed force, the resulting removal torque varies by cavity.
For multi-cavity operations, consistency across cavities matters more than the absolute application-to-removal ratio. A textbook ratio means nothing if two cavities out of 48 are systematically running 20% below the rest.
An East African bottling plant discovered this pattern. Random torque sampling pulled five caps per shift from the output stream, and numbers consistently fell within spec. But field complaints about leaking bottles persisted. When the QC team switched to per-cavity sampling — tracing each cap back to its mold cavity — a small number of cavities turned out to be producing bottles whose removal torque sat at or below the low boundary. Random sampling had been averaging those failures into a passing result.
| Sampling Method | What It Catches | What It Misses |
|---|---|---|
| Random (5 per shift) | Gross capper malfunctions | Cavity-specific drift |
| Stratified (rotate across cavities) | Cavity trends over time | Rapid single-cavity failures |
| Per-cavity (tag every sample) | Specific cavity deviations | Nothing — but labor-intensive |
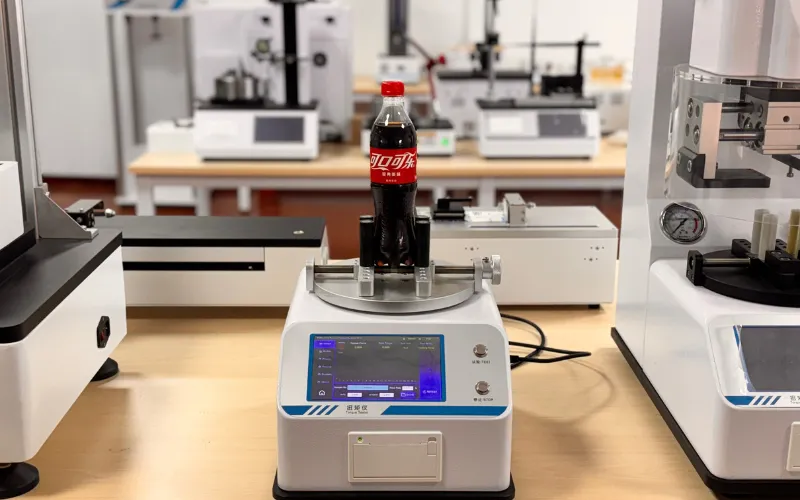
PCO finish types common on beverage bottles required specific fixture adaptation for accurate torque readings at that plant. Standard flat-jaw fixtures can slip on PCO thread profiles, producing readings that skew low.
For the 28 mm PCO 1881 closure on carbonated soft drink bottles, published ranges are 12-18 in-lb application and 8-14 in-lb removal.
If your line runs multi-cavity molds, pull your last week of torque data and sort it by cavity number. The spread tells you more than the average.
Testing That Actually Catches Problems: Sampling Plan Over Instrument Precision
Your torque tester reads to 0.1 in-lb. Your sampling plan pulls five caps per shift at random. Which one is the weak link?
Most QC teams, when complaints arise, look first at the instrument. Is it calibrated? Is the resolution high enough? These are reasonable questions, but they target the wrong bottleneck. A perfectly calibrated tester running under a sampling plan that misses cavity-level variation will produce clean-looking data while problems persist on the shelf.
The weak link in cap torque testing is almost always the sampling plan, not instrument accuracy. Random sampling at low frequency catches gross malfunctions: a capping head that seizes, a torque setting that drifts machine-wide. It misses localized problems. One cavity producing out-of-spec bottles. One capping head applying less force than the others.
| Sampling Design Element | Common Practice | Better Practice |
|---|---|---|
| Sample size | 5 per shift | 5 per cavity rotation cycle |
| Sample selection | Random from output | Tagged by cavity and capping head |
| Frequency | Every 2-4 hours | Every changeover + hourly during run |
| Data recording | Pass/fail only | Actual values with cavity ID |
| Review trigger | Out-of-spec result | Trend deviation within spec |
Machine setting is not the same as actual closure torque. The capper display shows the target, not the result. Actual torque on the finished package depends on cap dimensions, liner thickness, neck finish, and TE band geometry. When any input changes (new cap supplier, different liner compound, mold cavity replacement), the relationship between setting and actual torque shifts. Revalidation with an offline tester is the only way to confirm the real number.
A minimum useful sampling plan ties each reading to a production variable: cavity number, capping head position, time stamp. Without that traceability, your data answers "are we in spec now?" but cannot answer "where should we look when we fall out of spec?"
General Consumer Goods: Basic Compliance and Common Defects
General consumer goods packaging (household cleaners, personal care, food condiments) typically runs single-cavity molds or low-cavity-count tooling, where the 40-60% ratio is a workable guideline. These operations face less complexity than high-cavity beverage lines or pharma shelf-life protocols. Torque-related defects still occur, though, and knowing which measurement catches which defect saves diagnostic time.
| Defect | Description | Detected By |
|---|---|---|
| Cocked cap | Closure cross-threaded or seated at an angle | Removal torque reads abnormally high or erratic; visual inspection |
| Backing off | Cap loosens after application over minutes/hours | Removal torque at time delay reads lower than expected |
| Stripped threads | Over-torque damages closure or bottle threads | Application torque spikes then drops; removal torque near zero |
A cocked cap produces unusually high removal torque because misaligned threads create extra friction. The cap feels tight but is not sealed — it is jammed.
Backing off is the opposite. The cap passes immediate torque testing, but minutes later the reading has dropped because the TE band or liner is releasing stored elastic energy. A short delay between capping and testing (even 60 seconds) can reveal this pattern.
Stripped threads show a distinctive signature. Application torque climbs above normal, then drops sharply as thread material yields. Removal torque reads near zero because no thread engagement remains.
If removal torque is in spec but customers report leaks, the defect is usually seal integrity rather than torque. That requires a different test entirely, such as vacuum decay or pressure testing.